HDDS-2642. Expose decommission / maintenance metrics via JMX #3781
Conversation
…X and prom endpoints. Metrics object NodeDecommissionMetrics and associated unit tests inc. Preliminary integration into decommisioning workflow monitioring - see diff for details.
…t. Refactored monitor unit test utils for common use between unit tests for monitor and unit test for decommisioning progress metrics.
…ecommissioning_maintenance_nodes in DataAdminMonitorImpl as it was not captured properly by prom endpoint.
…tric for getting unhealthy container metric for nodes in decommissioning and maintenance workflow.
|
The changes look good, but I think it would be much more useful if we could track metric at the decommissioning node level too. Ie: I had a look at the ReplicationManagerMetric class, and in there, is an example of how to form a metric "on the fly" using: I think it should be possible store the counts per hostname in a map or list, and then when the metrics are snapshot, form dynamic metric names for the host level under / over / unhealthy container counts. Also keep the aggregate metrics. These host level metrics would let people see if one host is stuck or if all are making progress etc. |
| .class.getSimpleName(); | ||
|
|
||
| @Metric("Number of nodes tracked for decommissioning and maintenance.") | ||
| private MutableGaugeLong totalTrackedDecommissioningMaintenanceNodes; |
There was a problem hiding this comment.
The metric names should be renamed to follow standard conventions (we don't it everywhere in our code, but we should for new metrics). This way, when searching for metrics, we can first filter for what entity and then for which metric. Applicable to all metrics here.
| private MutableGaugeLong totalTrackedDecommissioningMaintenanceNodes; | |
| private MutableGaugeLong trackedDecommissioningMaintenanceNodesTotal; |
There was a problem hiding this comment.
Thanks @kerneltime for your review of this PR and for your comments. I've pushed changes in latest commit for naming the metrics in that manner for all metrics collected. ie. trackedDecommissioningMaintenanceNodesTotal.
|
HDFS has a metric like this: It seems to register a MBean instance in the FSNameSystem class. Then it has a few places it provides these JSON key values in the metrics. |
…maintenance workflow by HOST. Added tests for host based metrics monitoring. Also added name changes to metrics as per reviewer comments.
|
Thanks @sodonnel for your help to expose the decommission / maintenance metrics for monitoring the workflow. As you suggested, I've added metrics to monitor the workflow progress by host. These host based metrics are created dynamically and track the pipeline and container state for datanodes going through the decommissioning and maintenance workflow. The metrics include, |
|
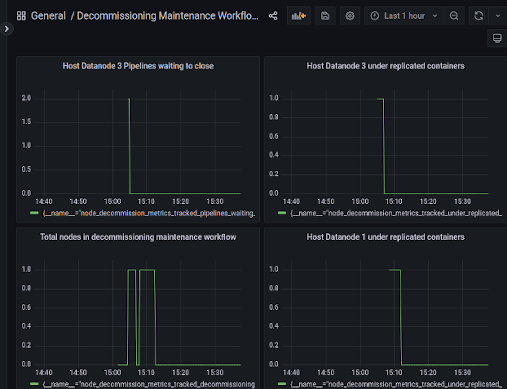
JMX and prom metrics collected for monitoring decommissioning and maintenance mode workflow updated to included collecting metrics by host. Examples of metrics captured follow. And, prom endpoint capturing decommissioning datanodes 3 and 1 in captured image: |
… to ensure metrics are refreshed in timely manner.
| private MutableGaugeLong trackedDecommissioningMaintenanceNodesTotal; | ||
|
|
||
| @Metric("Number of nodes tracked for recommissioning.") | ||
| private MutableGaugeLong trackedRecommissionNodesTotal; |
There was a problem hiding this comment.
Is tracked a bit superfluous here? These can be RecommissionNodesTotal unless the prefix tracked is adding more context here.
There was a problem hiding this comment.
The significance of tracked is coming from the convention in the monitor code which tracks the nodes in the decommissioning and maintenance workflow -
DatanodeAdminMonitorImpl.java javadoc: Once an node is placed into tracked nodes, it goes through a workflow where
the following happens:
and the corresponding log outputs,
INFO node.DatanodeAdminMonitorImpl: There are 1 nodes tracked for decommission and maintenance.
Would it be better to continue to use the prefix tracked, remove altogether, or perhaps another keyword uniform to the decommissioning/maintenance mode metrics to easily search for with jmx and prometheus?
There was a problem hiding this comment.
I think we can drop tracked and improve the readability when visualizing
There was a problem hiding this comment.
Thanks @kerneltime. Changes pushed see: #3781 (comment)
| private long underReplicatedContainers = 0; | ||
|
|
||
| @SuppressFBWarnings(value = "SIC_INNER_SHOULD_BE_STATIC") | ||
| private final class ContainerStateInWorkflow { |
There was a problem hiding this comment.
Rather than suppress the FB warning, can this class be made private final static class ...? I am not an expert in this area, but usually inner classes I've seen are static. The difference between static and non static inner classes seems to be that "non static" inner classes can directly access the enclosing classes instance variables and methods.
A static inner class cannot directly access the enclosing classes methods. It has to do it via an object reference.
In this case, the inner class is a simple wrapper around a set of variables and does not need to access the enclosing methods class, and therefore can be static I think.
There was a problem hiding this comment.
Thanks. Removed the suppress annotation and properly converted instead to static final nested class from the final inner class. As the inner class does not refer to the outer class instance, it should indeed be a static nested class.
...-hdds/server-scm/src/main/java/org/apache/hadoop/hdds/scm/node/DatanodeAdminMonitorImpl.java
Outdated
Show resolved
Hide resolved
| } | ||
|
|
||
| public void setAll(long sufficiently, | ||
| long under, |
There was a problem hiding this comment.
Formatting here seems off again - should either be 4 spaces in from the line above or aligned with the other parameters.
...-hdds/server-scm/src/main/java/org/apache/hadoop/hdds/scm/node/DatanodeAdminMonitorImpl.java
Outdated
Show resolved
Hide resolved
...p-hdds/server-scm/src/main/java/org/apache/hadoop/hdds/scm/node/NodeDecommissionMetrics.java
Outdated
Show resolved
Hide resolved
…inner class to private final static nested class. Code formatting indentation corrections not picked up by checkstyle.
|
|
||
| @VisibleForTesting | ||
| public Long getTrackedPipelinesWaitingToCloseByHost(String host) { | ||
| if (!trackedPipelinesWaitingToCloseByHost.containsKey(host)) { |
There was a problem hiding this comment.
These get methods could all be simplified to something like:
private static final MutableGaugeLong ZERO_GAUGE = new MutableGaugeLong;

return trackedPipelinesWaitingToCloseByHost.getOrDefault(host, ZERO_GAUGE).value()
There was a problem hiding this comment.
getters from metrics by host cleaned up in latest commit. getTrackedPipelinesWaitingToCloseByHost , please check.
| long num) { | ||
| trackedPipelinesWaitingToCloseByHost.computeIfAbsent(host, | ||
| hostID -> registry.newGauge( | ||
| Interns.info("trackedPipelinesWaitingToClose-" + hostID, |
There was a problem hiding this comment.
This block is repeated 4 times with just the name and value changing:
Interns.info("trackedSufficientlyReplicated-" + hostID,
                "Number of sufficiently replicated containers "
                    + "for host in decommissioning and "
                    + "maintenance mode"), 0L)).set(sufficientlyReplicated);
Could you move it into a private method to reduce the duplicated code?
There was a problem hiding this comment.
Thanks. Moved to new private method :
private TrackedWorkflowContainerState createContainerMetricsInfo
| this.replicationManager = replicationManager; | ||
|
|
||
| containerStateByHost = new HashMap<>(); | ||
| pipelinesWaitingToCloseByHost = new HashMap<>(); |
There was a problem hiding this comment.
Why split the pipelines into a seperate map? It looks like it would be easier overall to have a pipeline count setter on the ContainerStateInWorkflow object and just carry the pipeline count around with the containers etc too?
There was a problem hiding this comment.
Split between replication state and pipelines was for grouping - they are initialized and set in separate parts of the monitor code that resulted in using two separate maps to store the two. Looking to, as suggested, reuse the ContainerStateInWorkflow for the two, perhaps two different setters; one for the replication and the other for pipelines.
There was a problem hiding this comment.
Combined all metrics collected by host in monitor to ContainerStateInWorkflow as suggested.
| metrics.metricRecordPipelineWaitingToCloseByHost(e.getKey(), | ||
| e.getValue()); | ||
| } | ||
| for (Map.Entry<String, ContainerStateInWorkflow> e : |
There was a problem hiding this comment.
I might be wrong, but I think there is a bug here.
Lets say we put a host to maintenance. It will have some metrics tracked in the ByHost maps.
After each pass we reset these maps to have zero counts, but we don't remove the entries from the maps anywhere (unless I have missed it). Then we update the values accordingly.
Later the node goes back into service and even though it is removed from the monitor, it will be tracked with zero counts forever.
Over time on a long running cluster, we will build up a lot of "by host" metrics with zero values, when they really should be removed.
I think the reset will need to remove them from the maps rather than zeroing them, and also when setting the values to the metric gauge, you will need to remove values no longer there from it too.
It might be easier to pass a Map<String, ContainerStateInWorkflow> to the metrics class to facilitate removing the stale entries.
There was a problem hiding this comment.
@sodonnel , with the metrics registry it appears that the metrics we track remain in the registry. With this behavior, currently each datanode we add to track remains unless we have an api to remove it from the MetricsRegistry. Is there a way to delete/remove a gauge from the registry? See MetricsRegistry.java https://github.com/apache/hadoop/blob/03cfc852791c14fad39db4e5b14104a276c08e59/hadoop-common-project/hadoop-common/src/main/java/org/apache/hadoop/metrics2/lib/MetricsRegistry.java#L40.
There was a problem hiding this comment.
Huum, looks like you are correct. I wonder what the best approach is here.
I don't think its a great user experience if we start with no individual nodes track, and then over time (in a long running SCM) more and more nodes get added for maintenance and decommission and the number builds up all with zero counts. I guess its not a major problem, but it would be nice to resolve it somehow.
There was a problem hiding this comment.
In #3791 Symious added a tag with a group of metrics in JSON form. For the metrics system, this is just a tag to string, rather than a gauge, but we could group all currently decommissioning / maintenence nodes into a JSON representation to expose the fine grained info. If no nodes are in the workflow, it would just be an empty json object, so nodes can come and go easily.
Then you still have your aggregate metrics as they are now.
It is unlikely that someone would want to chart an individual DN as they would have to create a new chart for each DN.
What do you think?
There was a problem hiding this comment.
I've modified the code to dynamically (without using the helper MetricsRegistry class to add gauges) add to the collector as is done similarly in namenode topmetrics collections. See https://github.com/apache/hadoop/blob/eefa664fea1119a9c6e3ae2d2ad3069019fbd4ef/hadoop-hdfs-project/hadoop-hdfs/src/main/java/org/apache/hadoop/hdfs/server/namenode/top/metrics/TopMetrics.java#L167.
Here the metrics are collected dynamically by host when the host node is in the workflow. When the node exits the workflow, the metrics for that host are no longer collected. In the JMX, the node metrics are no longer in the output. Note this is true for JMX, the prom endpoint seems to retain the last value pushed. See the following metrics pushed out to JMX for the NodeDecommissionMetrics when datanode-2 is decommissioned:
before

"name" : "Hadoop:service=StorageContainerManager,name=NodeDecommissionMetrics",
    "modelerType" : "NodeDecommissionMetrics",
    "tag.Hostname" : "0d207b6cbbf1",
    "TrackedDecommissioningMaintenanceNodesTotal" : 0,
    "TrackedRecommissionNodesTotal" : 0,
    "TrackedPipelinesWaitingToCloseTotal" : 0,
    "TrackedContainersUnderReplicatedTotal" : 0,
    "TrackedContainersUnhealthyTotal" : 0,
    "TrackedContainersSufficientlyReplicatedTotal" : 0
  }, {

during
    "name" : "Hadoop:service=StorageContainerManager,name=NodeDecommissionMetrics",
    "modelerType" : "NodeDecommissionMetrics",
    "tag.Hostname" : "0d207b6cbbf1",
    "TrackedDecommissioningMaintenanceNodesTotal" : 1,
    "TrackedRecommissionNodesTotal" : 0,
    "TrackedPipelinesWaitingToCloseTotal" : 2,
    "TrackedContainersUnderReplicatedTotal" : 0,
    "TrackedContainersUnhealthyTotal" : 0,
    "TrackedContainersSufficientlyReplicatedTotal" : 0,
    "TrackedUnhealthyContainers-ozone-datanode-2.ozone_default" : 0,
    "TrackedSufficientlyReplicated-ozone-datanode-2.ozone_default" : 0,
    "TrackedPipelinesWaitingToClose-ozone-datanode-2.ozone_default" : 2,
    "TrackedUnderReplicated-ozone-datanode-2.ozone_default" : 0
  }, {

  }, {
    "name" : "Hadoop:service=StorageContainerManager,name=NodeDecommissionMetrics",
    "modelerType" : "NodeDecommissionMetrics",
    "tag.Hostname" : "0d207b6cbbf1",
    "TrackedDecommissioningMaintenanceNodesTotal" : 1,
    "TrackedRecommissionNodesTotal" : 0,
    "TrackedPipelinesWaitingToCloseTotal" : 0,
    "TrackedContainersUnderReplicatedTotal" : 1,
    "TrackedContainersUnhealthyTotal" : 0,
    "TrackedContainersSufficientlyReplicatedTotal" : 0,
    "TrackedUnhealthyContainers-ozone-datanode-2.ozone_default" : 0,
    "TrackedSufficientlyReplicated-ozone-datanode-2.ozone_default" : 0,
    "TrackedPipelinesWaitingToClose-ozone-datanode-2.ozone_default" : 0,
    "TrackedUnderReplicated-ozone-datanode-2.ozone_default" : 1
  }, {

after
 }, {
    "name" : "Hadoop:service=StorageContainerManager,name=NodeDecommissionMetrics",
    "modelerType" : "NodeDecommissionMetrics",
    "tag.Hostname" : "0d207b6cbbf1",
    "TrackedDecommissioningMaintenanceNodesTotal" : 0,
    "TrackedRecommissionNodesTotal" : 0,
    "TrackedPipelinesWaitingToCloseTotal" : 0,
    "TrackedContainersUnderReplicatedTotal" : 0,
    "TrackedContainersUnhealthyTotal" : 0,
    "TrackedContainersSufficientlyReplicatedTotal" : 0
  }, {
The host datanode-2 metrics no longer visible as the node exits the workflow.
This seems to follow how hadoop handles metrics collected dynamically, however the prom endpoint seems to retain the last pushed value for some reason. Is this what we should expect when collecting metrics for hosts as they go in and out of the workflow?
There was a problem hiding this comment.
I'm not sure how the prom end point works. Its not ideal that it keeps the last value pushed, but I am not sure where that code even comes from!
There was a problem hiding this comment.
Thanks. We should go forward with using this implementation that works for JMX metrics for completing this PR to expose decommission / maintenance metrics via JMX and open a new jira to look into supporting the prom endpoint. This PR supports metrics tracking the decommission and maintenance workflow both with aggregated counts and DN host specific counts. A jira will be filed to track prom endpoint behavior for the metrics. What do you think?
|
Thanks for updating the formatting. I have a few more comments around code reuse and also a possible bug to check on. Also a conflict has appeared against one class which needs resolved. |
|
One other thing I spotted: The host level metrics start with a lower case letter, but the others start with upper case. We should be consistent here inline with what other metrics do. |
…bject and for consistent snapshot pulled by metricsSystem from metrics object. Cleanup of metrics reset and refinement to metrics gathered by host to follow.
Thanks. Pushed similar changes for simplification and fix for synchronization issue in latest commit after revert. Some minor cleanup and changes to follow. |
…aintenance mode metrics collected by HOST to be a metricRecord with tag associated with gauge. With change, allows a single metric name for all host (node) based container state metrics. Within the single name, ie. TrackedSufficientlyReplicatedDN is a tag displayed that identifies the host node for the metric. Works for both JMX and can be displayed graphically/table form by Prometheus.
|
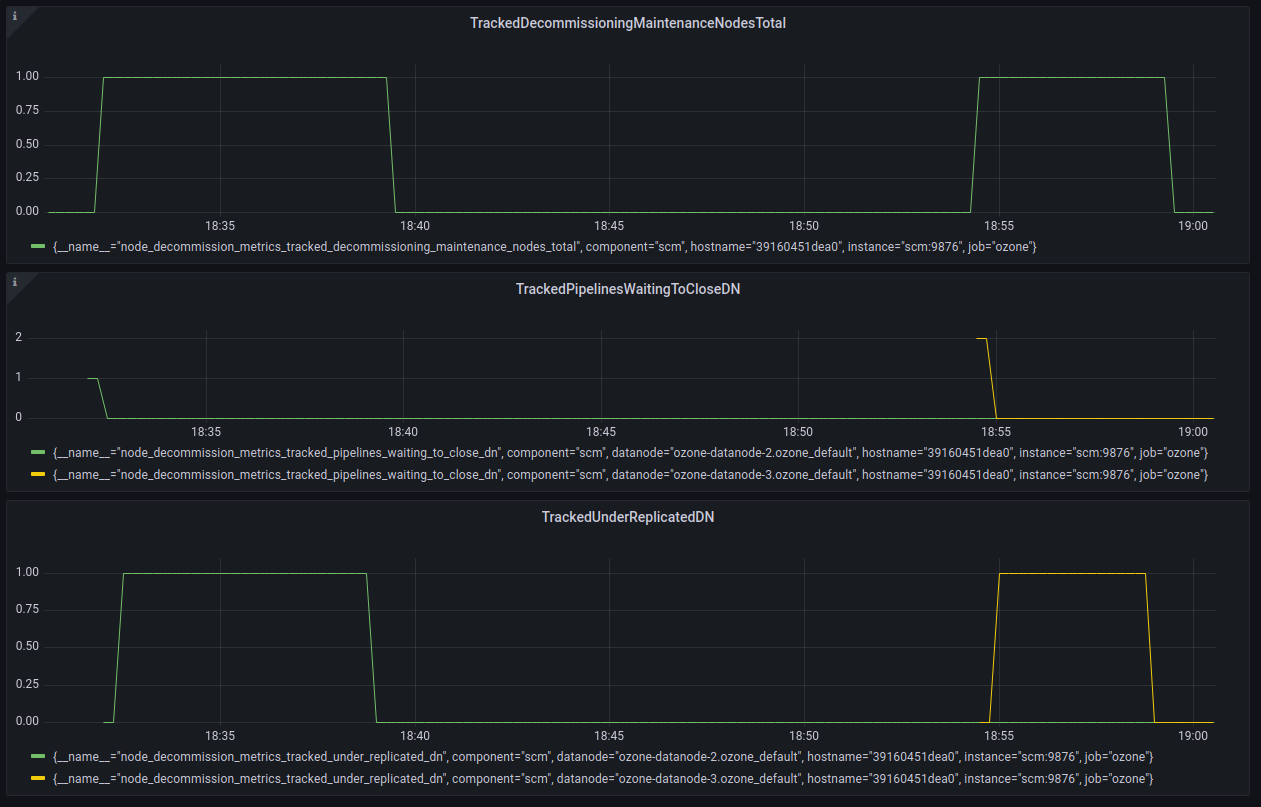
Pushed new changes that finish the clean up for the metrics reset and collection in the monitor. In addition the metric in the NodeDecommisionMetrics changed for container state metrics per node in the workflow. Now, a single metric name is used for the same metric collected for each datanode, within the metric is an associated tag that identifies the node for the metric reading, ie. `node_decommission_metrics_tracked_sufficiently_replicated_dn{datanode="ozone-datanode-2.ozone_default",hostname="39160451dea0"}. The decommissioning / maintenance workflow is tracked by JMX displaying each aggregated metric and displaying the node container state metrics only when the node is in the workflow. Prometheus now also displays each aggregated metric but now under a unique metric name for each container state metric, displays each host associated with the reading as a tag. This can be seen below in a workflow decommissioning during: after, and Prometheus, decommission datanode-2 (green) and datanode-3 (yellow):
|
|
Note filed jira for problem with the master branch for prometheus scraping scm metrics from prom endpoint. This affects our metrics monitoring with prom as well as the scm related metrics such as the |
|
Hi @sodonnel, currently the release of Ozone-1.3 is blocked on this PR. Could you help continue to review this PR? |
|
I'm out of the office this week. I will look at this again on Monday. I don't think this PR is essential for the 1.3 release as we have lived without these metrics up until now. |
|
Thanks @sodonnel for the feedback. |
|
Hi @captainzmc , thanks for reaching out for this PR to be included in the 1.3 release. This patch is actually something that we would like to have in the 1.3 release. Such functionality is new and needed for our production environment. We would like to use this included in the 1.3 stable release. Please do continue to include this PR in 1.3 release blocked list. |
|
@captainzmc, having visibility on the decommissioning / maintenance process its something quite important from an operational point of view if you want to run a production cluster. Our operational team will be very reluctant to use ozone in prod without that as they will not know what's happening or not. Its probably a fundamental feature from an operational point of view. We want to use the 1.3 version as it will be widely use and not a master branch later. This is why we would like to have it included in the 1.3. |
|
Thanks @neils-dev @michelsumbul for the feedback. I got you point. Sure. let's keep this PR in 1.3 release blocked list. |
Sorry, github was showing me the wrong commit (or I was being stupid!). I see it now. |
| for (Map.Entry<String, ContainerStateInWorkflow> e : | ||
| containerStatesByHost.entrySet()) { | ||
| trackedWorkflowContainerMetricByHost | ||
| .computeIfAbsent(MetricByHost.SufficientlyReplicated |
There was a problem hiding this comment.
I don't think we need all the computIfAbsent calls here - we just cleared the map so they are always going to be absent, so just put the new value.
Its a bit strange that we have 4 tags for the same DN. The way I'd expect this to work is we have 1 tag per DN, and then the 4 metrics (under, sufficiently, pipelines, unhealthy) all sharing that tag. I think this is due to the way you are adding the tags in It might be easier if you simply stored a Set or Map of Example of what I mean, plus more simplifications - sodonnel@673109c |
…low inner class to encapsulate host metrics used in both metric object for metric publication and in monitor in separate instances for data collection. Cleaned up host metrics tags so that each host workflow metrics are tagged together under its datanode and hostname.
|
Latest push contains both simplification changes to
example with datanode 1 and datanode 3 in decommissioning workflow as captured by monitor: |
|
@sodonnel , for a possible fix for handling The flush of old stale metrics and populating the internal PrometheusMetricsSink Map can be handled similar to a resolved HDFS jira, HADOOP-17804. |
|
Yes it makes sense to open a new Jira for the prometheus issue. The tagged metrics look better now - we have one tag per DN, which is what I would expect. |
 sodonnel
left a comment
sodonnel
left a comment
There was a problem hiding this comment.
Changes look good now. Thanks for pushing through all the suggestions - I think its much cleaner now than when we started, and the "tag" idea for the metrics is good too - I had not seen that before.
@kerneltime has a suggestion on removing "tracked" from the metrics names to make them shorter - I am happy either way, but lets wait for him to comment before we commit.
|
Thanks @kerneltime , @sodonnel for the comment on removing the prefix "tracked" from metrics published through the NodeDecommisionMetrics. Sounds good. I've updated the code, now metrics are pushed as for jmx,
and on the prom endpoint,
|
…ublished metrics. Affects metric gauge getter and setter methods.
|
Latest changes look good. Please have a check @kerneltime and we can commit if you are happy. |
|
Thanks @neils-dev for the patch, and thanks @sodonnel @kerneltime for the review, let's merge this. |
…3781)

* Expose decommission / maintenance metrics via JMX
|
Thanks @sodonnel , @kerneltime , @captainzmc . |
What changes were proposed in this pull request?
To expose metrics from nodes entering the decommissioning and maintenance workflow to JMX and prom endpoint. These metrics expose the number of datanodes in the workflow, the container replication state of tracked nodes and the number of pipelines waiting to close of tracked nodes. With the following exposed metrics from the
NodeDecommissionManagerthrough theDataAdminMonitorImplthe progress of the decommission and maintenance workflow can be monitored.The progress of datanodes going though the workflow are monitored through aggregated counts of the number of tracked nodes, their number of pipelines waiting to close and the number of containers in each of sufficiently, under-replicated and unhealthy state. The metrics collected are as discussed in the associated Jira comments,
As exposed to prom endpoint:
aggregated total number of datanodes in workflow:
node_decommission_metrics_total_tracked_decommissioning_maintenance_nodesOf tracked datanodes in workflow, the container replication state; total number of containers in each of sufficiently replicated, under-replicated and unhealthy state
Of tracked datanodes in workflow, the aggregated number of pipelines waiting to close
node_decommission_metrics_total_tracked_pipelines_waiting_to_closeAnd, the number of datanodes in the workflow that are taken out and recommissioned.
node_decommission_metrics_total_tracked_recommission_nodesSimilarly exposed via JMX:
What is the link to the Apache JIRA
https://issues.apache.org/jira/browse/HDDS-2642
How was this tested?
Unit tests, CI workflow and manually tested with dev docker-cluster entering nodes in decommissioning workflow monitoring metrics collected in prom endpoint.
Unit tests:
hadoop-hdds/server-scm$ mvn -Dtest=TestNodeDecommissionMetrics testINFO] -------------------------------------------------------
[INFO] T E S T S
[INFO] -------------------------------------------------------
[INFO] Running org.apache.hadoop.hdds.scm.node.TestNodeDecommissionMetrics
[INFO] Tests run: 8, Failures: 0, Errors: 0, Skipped: 0, Time elapsed: 1.072 s - in org.apache.hadoop.hdds.scm.node.TestNodeDecommissionMetrics
[INFO]
[INFO] Results:
[INFO]
[INFO] Tests run: 8, Failures: 0, Errors: 0, Skipped: 0
[INFO]
Manual testing via dev docker-cluster:
modify the docker-config for scm serviceid and serviceid-address:
hadoop-ozone/dist/target/ozone-1.3.0-SNAPSHOT/compose/ozone$OZONE-SITE.XML_ozone.scm.nodes.scmservice=scm
OZONE-SITE.XML_ozone.scm.address.scmservice.scm=scm
set docker-compose for monitoring with prometheus:
export COMPOSE_FILE=docker-compose.yaml:monitoring.yaml
hadoop-ozone/dist/target/ozone-1.3.0-SNAPSHOT/compose/ozone$ docker-compose up -d --scale datanode=3view metrics through prom endpoint : http://localhost:9090
Decomission datanode from scm bash prompt:
$ ozone admin datanode decommission -id=scmservice --scm=172.26.0.3:9894 3224625960ec